Accurate forecasting and the efficient control of batteries are urgent objectives of any company that produces electric devices. Thus, Volodymyr Andrushchak, Lemberg Solutions Data Science Engineer, decided to conduct in-depth research on Battery Management Systems (BMSs), providing a detailed analysis of State of Charge (SoC) and State of Health (SoH) algorithms. Continue reading the study to learn how our innovative solution enables a safer end-user experience and maximizes battery lifespan.

 What’s wrong with typical BMS algorithms?
Each electric device requires a specific electricity type, rapid resource allocation, and efficient forecasting. These conditions are especially relevant for systems that consist of more than one cell (see Figure 1).
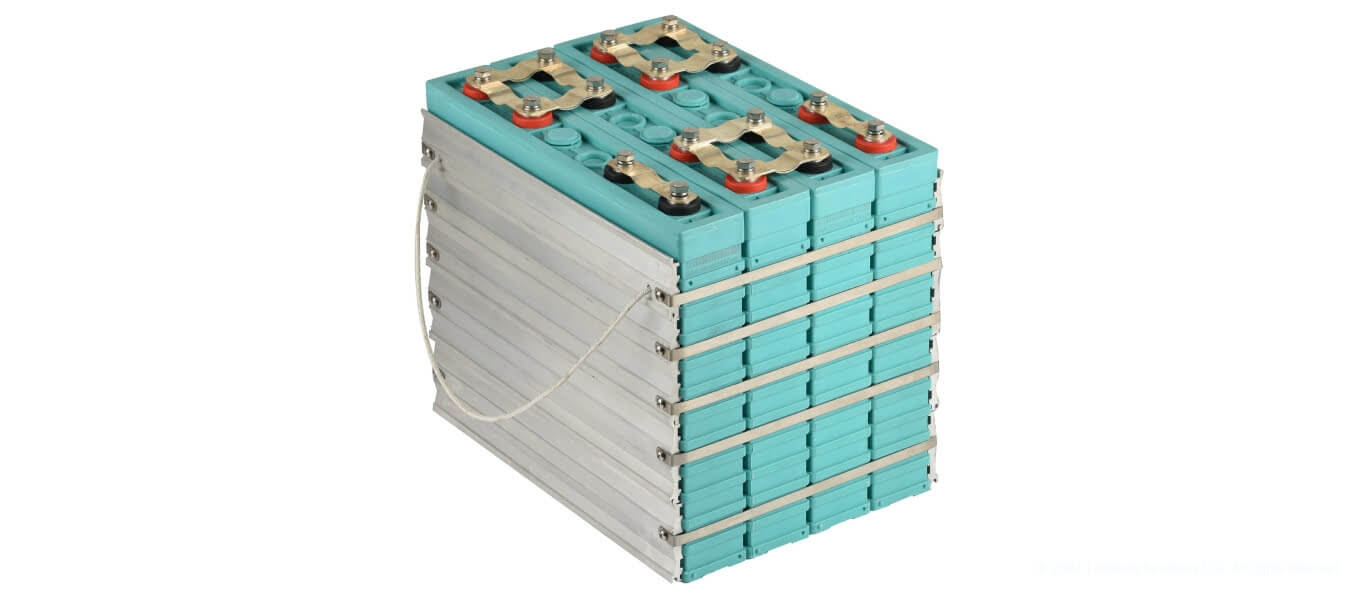
Figure 1. 12 V series and parallel connection Li-ion battery packs
Present-day electric transport batteries consist of a set of cells with sequential and parallel connections that provide necessary energy density and power (see Figure 2). Embedded engineering plays a crucial role in controlling such systems, ensuring their uninterruptible operation. Battery management systems are used to control such structures.
Basic functions of transport batteries:
- Measuring cell voltage level
- Protecting against overcharge and overdischarge
- Controlling temperatures, etc.
They also define derived values:
- State of Charge (SoC)
- State of Health (SoH)
- State of Power (SoP), etc.
Currently, basic battery monitoring and their passive/active balancing is ensured by BMS chips like AD7280, LTC6813, AN84910UA, bq76PL455A.
In addition to the basic control, other chips, like MC33772, provide the user with information about the cell using Coulomb counting and other basic algorithms. The issue with this algorithm is that it has a large error margin, which can be critical for the effective control of the battery charge. Other BMSs, like MAX1726x, use Open Circuit Voltage (OCV) based algorithms, which take into account the battery temperature effect and "fill the gaps" of the Coulomb counting algorithm limitations.
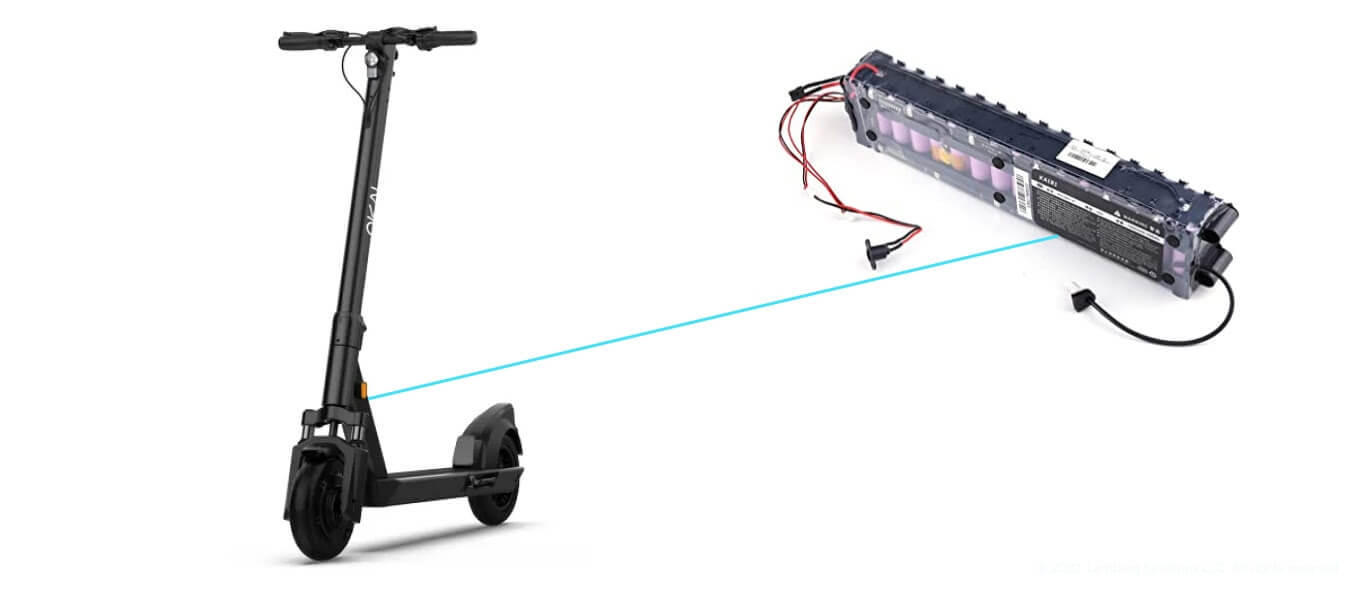
Figure 2. An electric scooter battery
Still, algorithms that determine charge levels using battery model representations can be quite memory-consuming. Besides, such algorithms often fail to take into account the analog-to-digital converter (ADC) noise and other irrelevant input within the battery set.

Figure 3. The examined battery—Samsung INR18650-30Q
BMS algorithms often ignore other battery parameters, such as State of Health (SoH). SoH protects the end-user from a sudden device failure by assessing the battery's "health." For example, an electric scooter containing a set of 11 batteries of the 18650 type connected in a series (see Figure 3) with a rated voltage of 3.7 V will generate a rated voltage of 40.7 V. The voltage operating ranges in relation to the cells will vary from 30.8 V to 46.2 V. If one of the cell's voltage falls below the lower voltage limit, e.g. 2.5 V, while the total voltage is under the lower limit of the motor operation, an electric vehicle can fail or even light up (see Figure 4).

Figure 4. An electric scooter caught fire in downtown D.C.
Existing BMSs usually don't provide turnkey solutions on State of Health determination algorithms. This is because the determination of SoH is influenced by a large number of parameters—capacity, structure, the material of battery cathodes and anodes, operating cycles, etc. Thus, such algorithms require an individual approach for different types of batteries.
SoC and SoH are indirect parameters which can't be measured physically. That's why it's so complicated to clearly define these values — you can only estimate and predict them.
Our research presents the development of SoC and SoH algorithms based on an Extended Kalman filter and statistical methods, which bypass several limitations of the previously described algorithms.
 Collecting test data for our research
Figure 5 demonstrates the collection of relevant test and experimental data for our research.
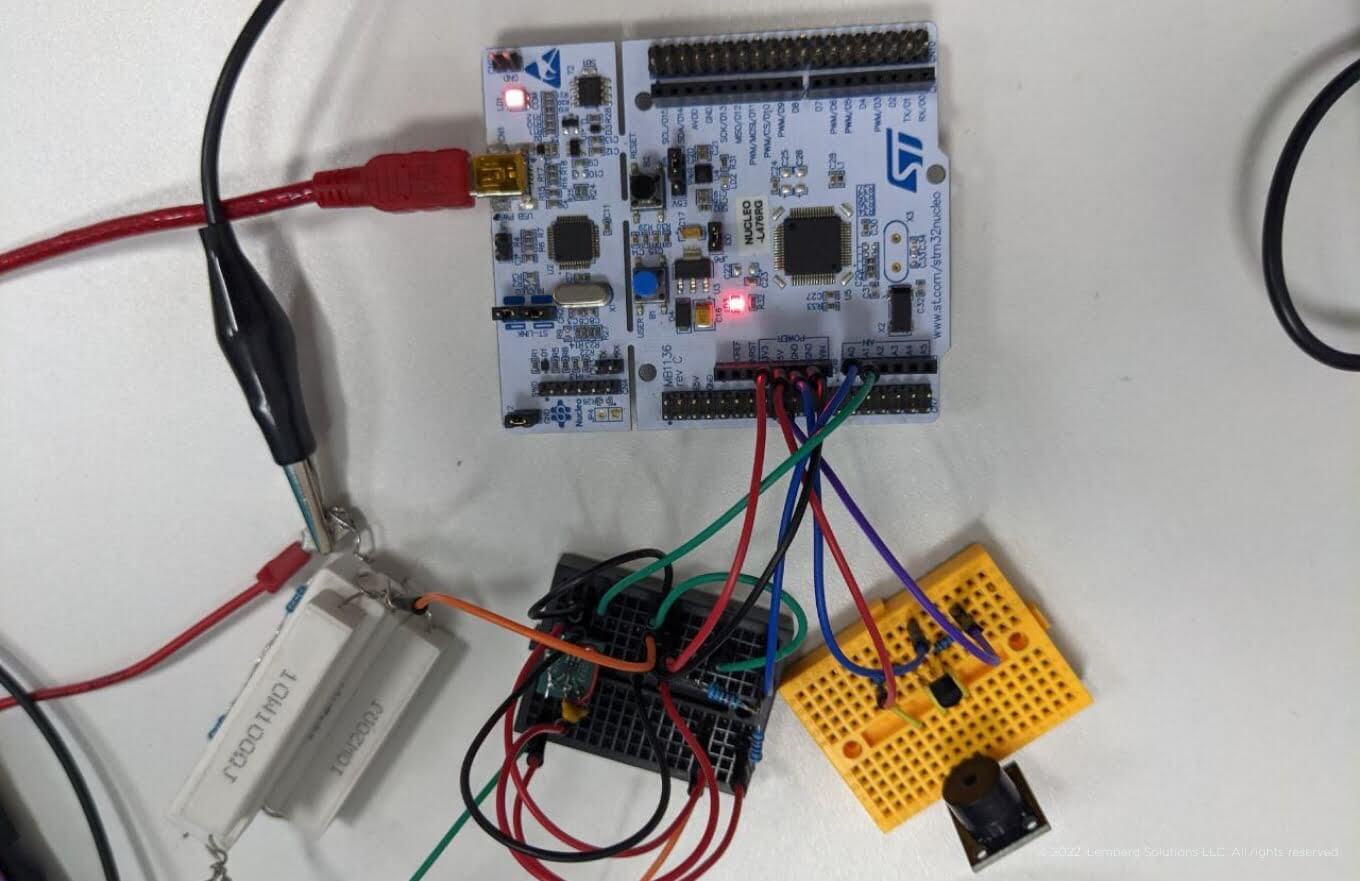
Figure 5. Data acquisition unit for SoC and SoH algorithms using the test battery INR18650-30Q
The Samsung INR18650-30Q battery with a capacity of 3000 mA was used as a test battery (visible in Figure 3). The physical parameters of this battery are presented in Table 1.
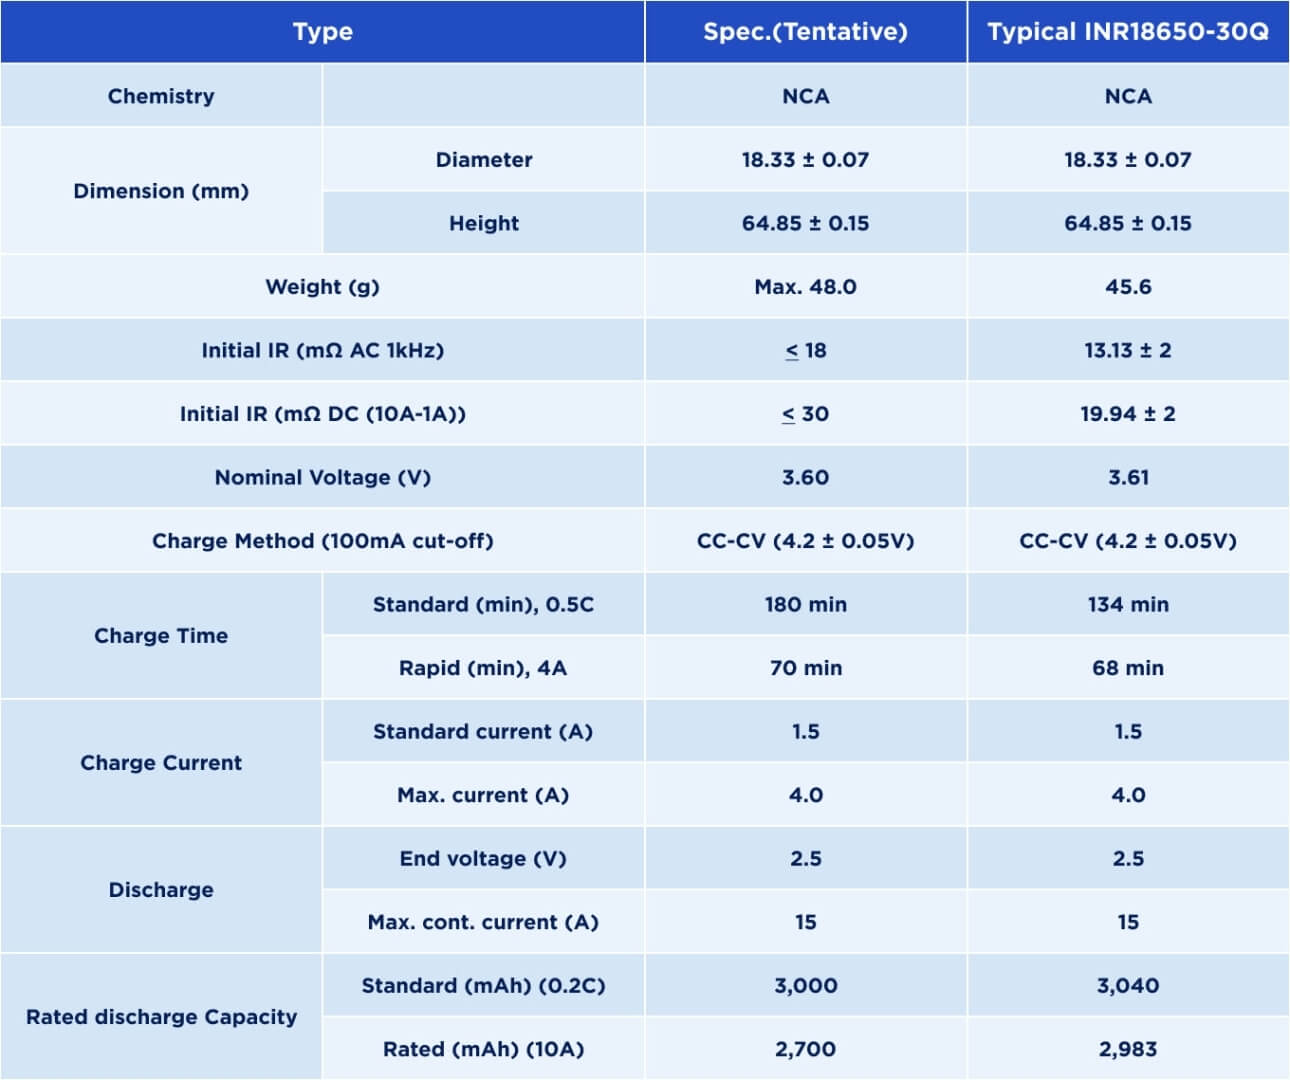
Table 1. The physical parameters of the INR18650-30Q battery
We used ST Nucleo F401RE as the microcontroller and development board. We also applied ceramic resistors to simulate the load, enabling a 0.7 A discharge. The installation is necessary to collect the appropriate OCV at different temperature values. Charge and discharge within 2.8 V and 4.2 V are produced to obtain the corresponding upper and lower voltages.
In the examined system, 0% SoC equals 2.9 V battery, while 4.1 V matches 100%. This is necessary to extend battery use cycles. Data is logged every 10 seconds.
This experimental installation allows us to:
- Collect all necessary voltage data to build OCV models
- Determine the required Equivalent Circuit Model (ECM) parameters
- Test the SoC and SoH algorithms.
 How to determine the SoC value precisely?
As it has already been mentioned, our solution is based on the Extended Kalman filter. The Kalman filter is based on iterative error reduction to achieve relevant outcomes. There are two key reasons why we need to utilize the Extended Kalman filter:
1. The SoC value is changed non-linearly in relation to the voltage
2. Other parameters such as temperature and noise affect the SoC value.
To determine SoC using the Extended Kalman filter, it is necessary to:
- Define OCV for our battery type, as well as for different environments and battery temperatures
- Utilize battery representation based on ECM parameters.
 OCV model description
The OCV model shows the dependence of the voltage level from SoC. Most of the SoC algorithms are solely based on the OCV curve, with SoC being determined using the battery voltage level.
Our solution applies three dependencies:
- Dependence of voltage from SoC
- SoC dependence from the voltage (the inverse value that determines SoC based voltage level)
- The one derived from previous dependence.
Figure 6 shows the discharge characteristic of the OCV experimentally removed from the 18650 battery (at a 0.2 A current ranging between 4.1 V and 2.9 V).
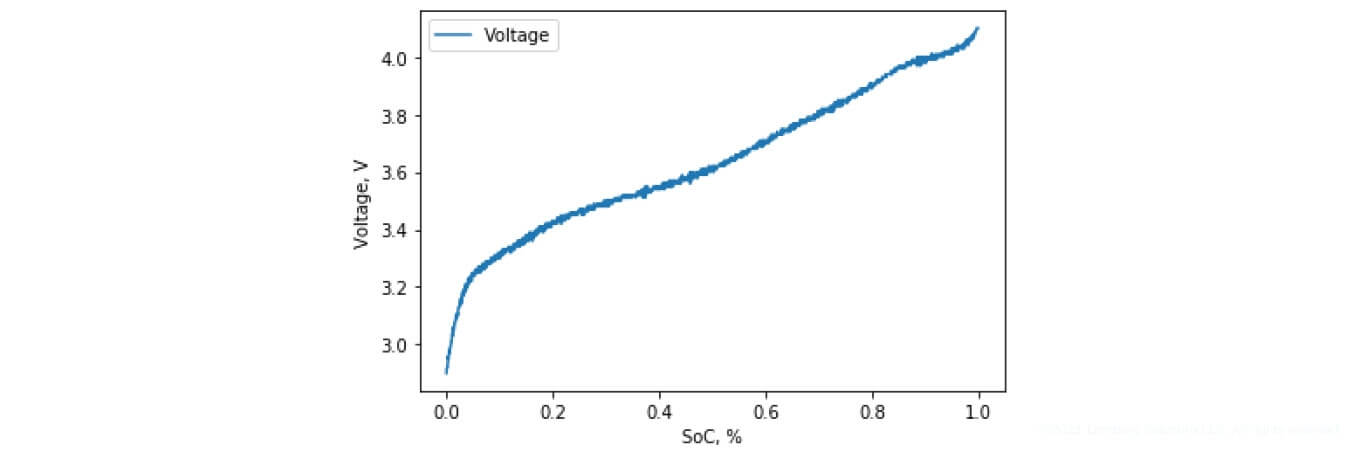
Figure 6. Experimental discharge of the OCV battery INR18650-30Q
The SoC algorithm based on the Extended Kalman filter (EKF) uses the dependence of voltage from SoC, meaning SoC defines the voltage value. This dependence is utilized in the adjustment zone of the EKF algorithm, where the SoC value is fixed according to the measured and estimated voltage value.
The derivative of the preceding characteristic is represented in the following Figure 7, depicting the change of the function that describes the SoC non-linearity. In the algorithm under study, two characteristics are described using polynomials in the 8th and 9th degree (see Figure 8).
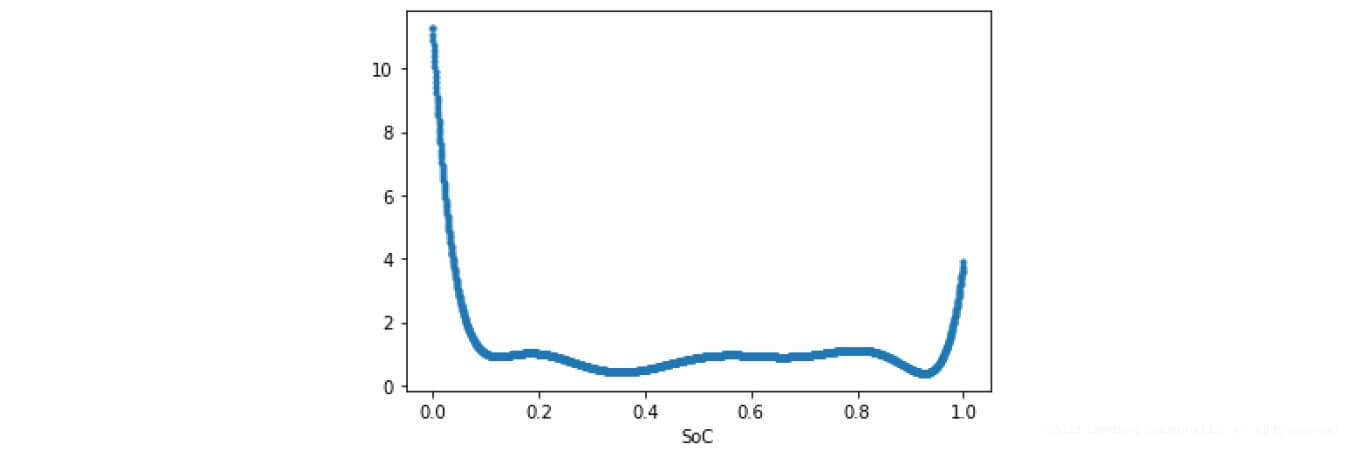
Figure7. Derived from OCV
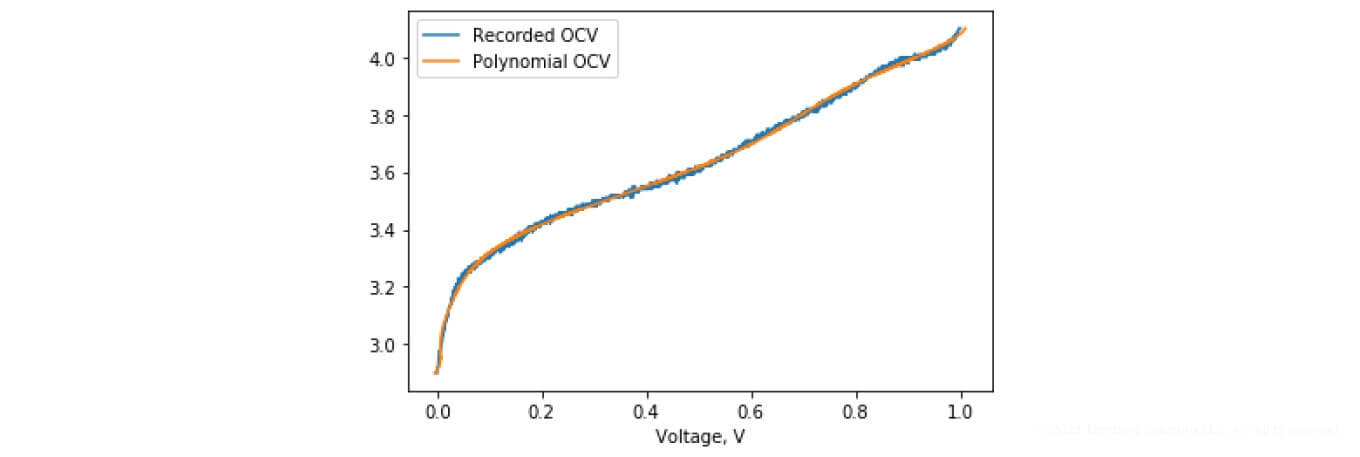
Figure 8. A trained polynomial in the 9th degree for OCV curve description
SoC undergoes the most significant transformations throughout the first and last 10% of battery operation, according to the collected characteristics and figures. In the range from 10% to 90%, SoC transforms according to the linear dependence.
 ECM model description
One of the EKF-based SoC algorithm parts is responsible for predicting a specific value (in this case SoC). For this, we need an appropriate equivalent model, which will represent the researched object. In our case these are the batteries. ECM is used as a model in such cases. In our study, the battery is presented based on a first-order linear circle — the Thevenin model. This battery model is represented by an RO resistor and a parallel RC element—see Figure 9.
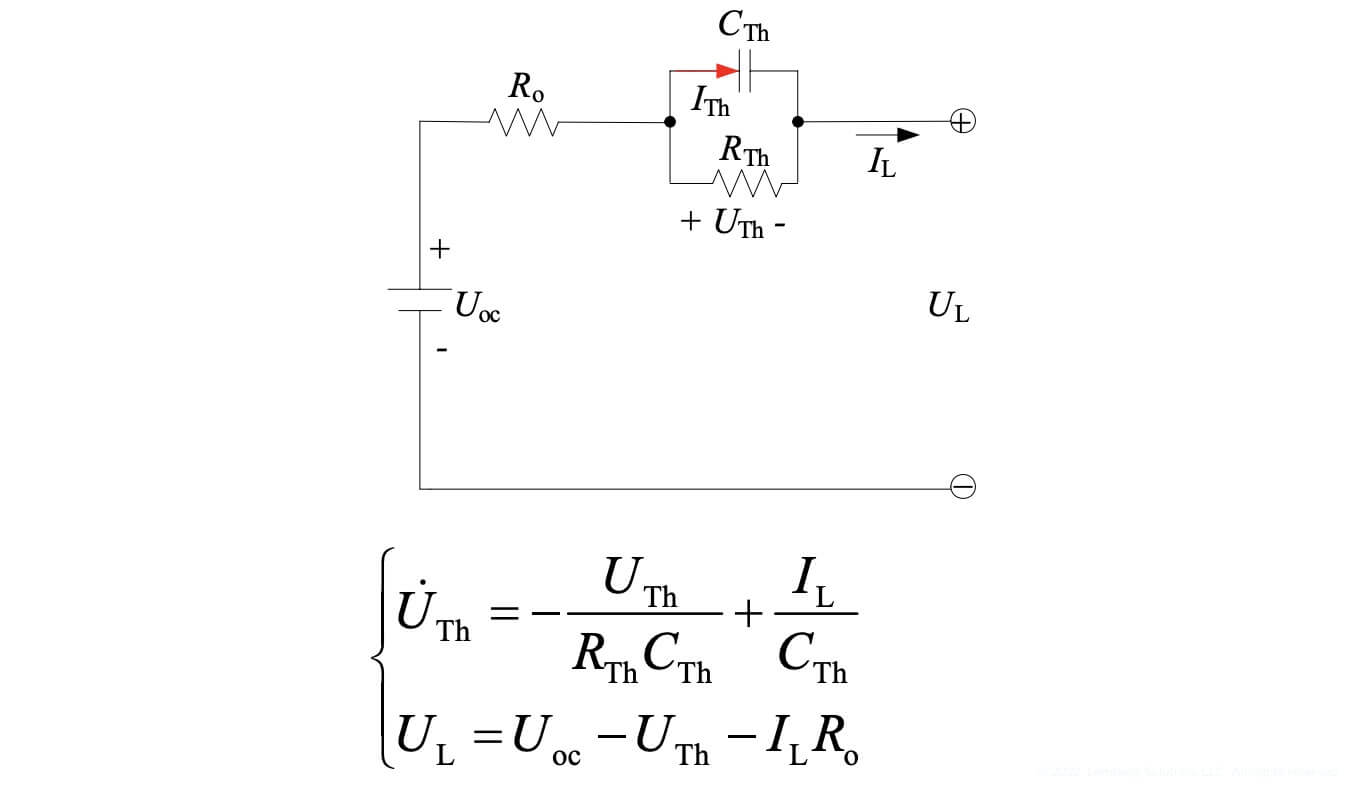
Figure 9. Presentation of the solutions used
The UL is the resulting voltage applied to the load, which can be measured using an ADC. RO is the internal resistance of the source (resistance of the electrolyte, electrodes, and other elements). Rth and Cth form a parallel element that simulates the internal transition processes of the power supply during charging and discharging. Thus, the resulting voltage supplied to the load equals the OCV voltage minus the voltage drop, which occurs due to the internal resistance and the parallel RC element. These characteristics can be determined by the HPPC test.
In this research, we also use the ECM values available in open source.
 Description of the SoC algorithm based on the Extended Kalman filter
Figure 10 demonstrates a block-diagram of the algorithm for determining SoC using the Extended Kalman filter. First, it is necessary to initiate the algorithm operation to determine the level of the cell voltage and temperature. The temperature value helps to initialize OCV appropriately and fix the SoC index using the EKF algorithm.
Next, we determine the initial SoC level using a corresponding OCV model, which is based on the appropriate voltage level. You can choose the initial SoC value randomly or select a specific limiting value (e.g. 0% or 100%). The Kalman filter based algorithm improves accuracy iteratively according to the measured value.
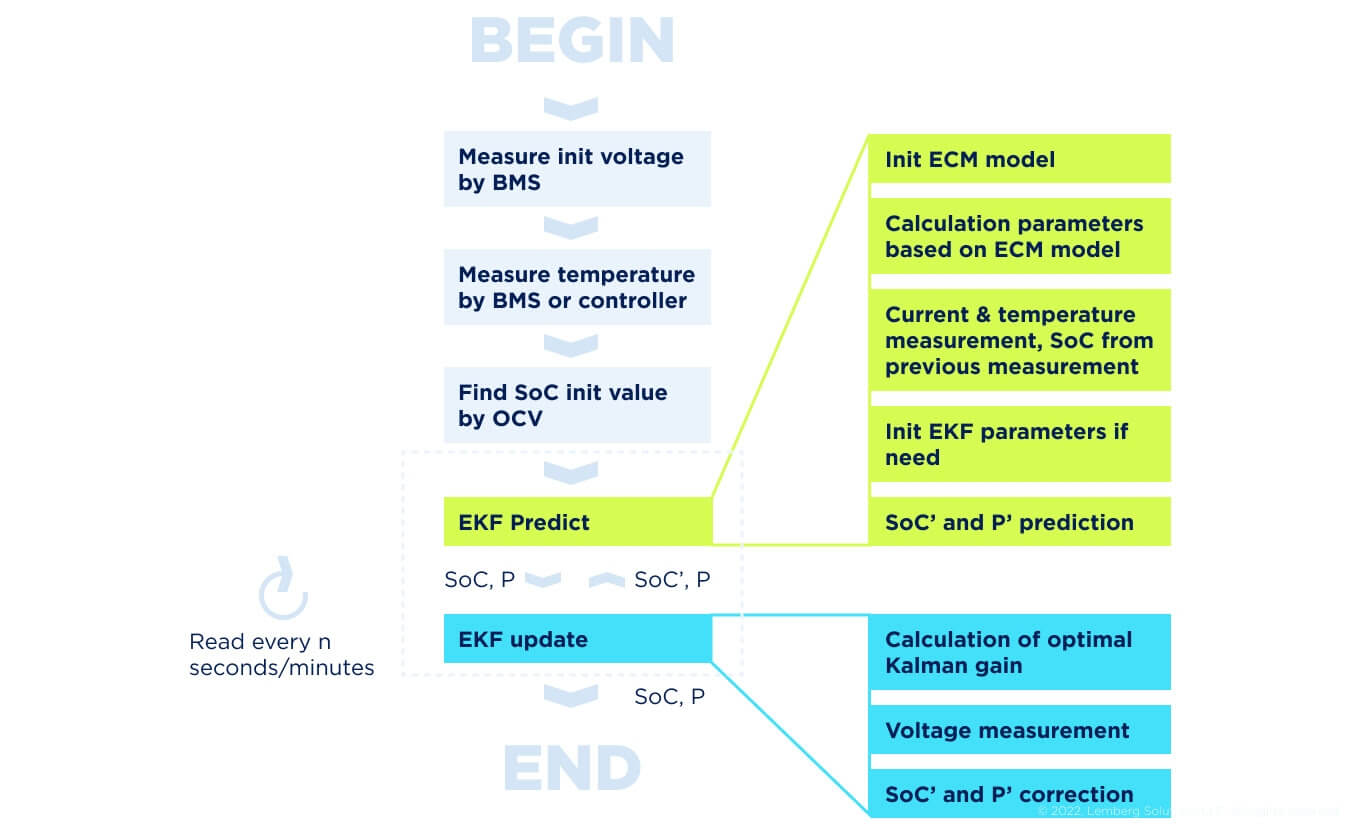
Figure 10. Block-diagram of the algorithm that determines the SoC value based on the Extended Kalman filter
Once the SoC has been initially determined, we move on to the EKF. First, we initialize the ECM and EKF filter parameters to perform the first iteration of this algorithm. After that, we measure the temperature (to correctly select OCV) and the current.
We predict the present SoC value and the new covariance matrix P based on:
- The ECM
- Battery capacity and current values
- The SoC level
- Covariance matrix P for the prior measurement.
After that, the SoC and P values are transmitted to the next block, where the data is corrected using the measured voltage and the Kalman ratio. The reference values from this block are the output values of the SoC algorithm. Besides, these SoC and P values will be used for the next iteration of SoC determination.
Experiment:
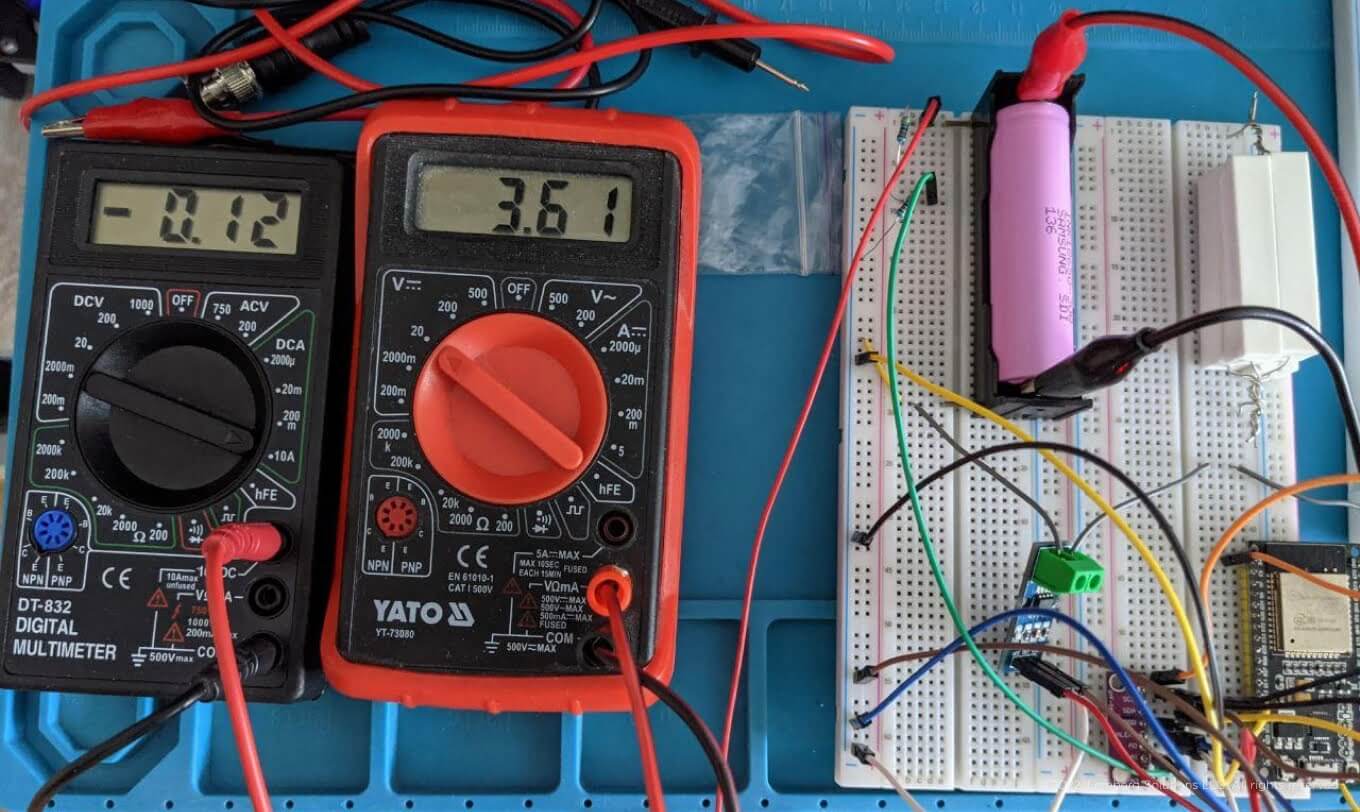
Figure 11. Battery charge/discharge experiment
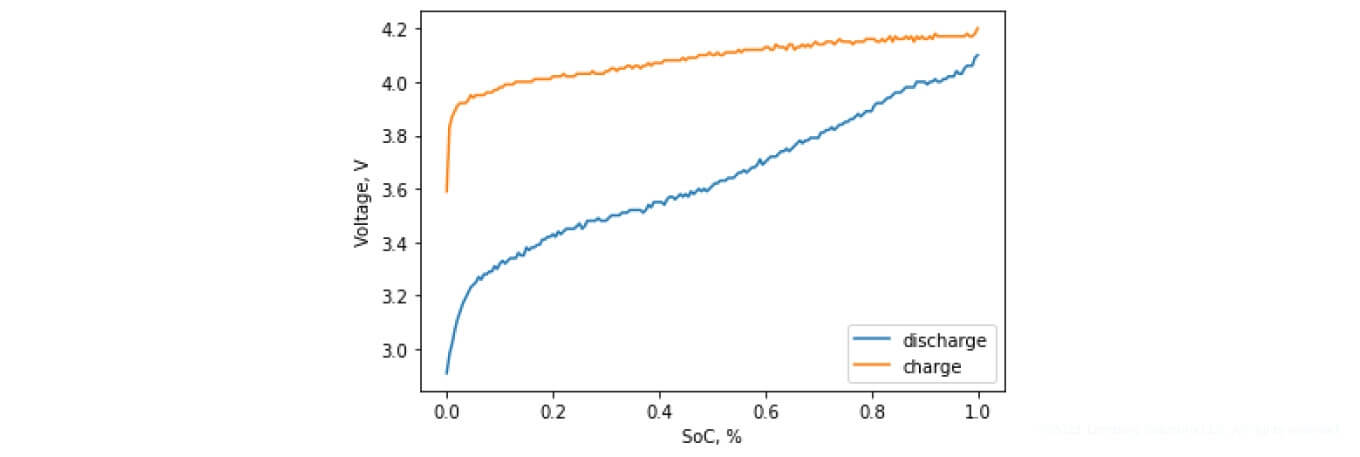
Figure 12. Charging and discharging characteristics in relation to the SoC level
Figures 11-12 depict the experimental setups and their corresponding charging and discharging characteristics. During the research, we took into account the internal resistance and battery transients. However, we did not consider the hysteresis, which ultimately affects the SoC value result. Thus, the use of EKF for the SoC determination algorithm, without taking into account the hysteresis for large current values, significantly affects the accuracy of the defined SoC value.
 How to determine the SoH value accurately?
Description of the existing solutions
Determining the level of battery health is crucial in terms of predicting the remaining power and reserve, as well as ensuring the safety of the end-user. If the battery has lost 20% of its capacity (SoH 80%), it should be replaced. The SoH parameter is defined as the ratio of the current battery capacity to the original capacity in percent. Battery impedance and capacity make it possible to determine the given parameter.
However, similar to the SoC parameter, SoH cannot be physically measured. Evaluation methods enable us to determine this parameter with a certain level of accuracy. To date, there are plenty of algorithms based on model representations of battery operation, as well as statistical methods representing the correlation between the corresponding reference models.
In this research, we use a statistical research method—the SoH value is determined by comparing the charging curve with reference values that correspond to certain SoH percentages.
 Which datasets did we use in our research?
In our study, we utilized an open-access INR18650 MJ1 battery dataset, which represents 400 charge and discharge cycles of the 18650 battery (3500 mA capacity).
Figure 13 shows the change in the capacity of the examined battery throughout 400 test charge and discharge cycles, formed on the basis of discharge characteristics. Figure 14 presents the same SoH characteristic expressed in percentage terms.
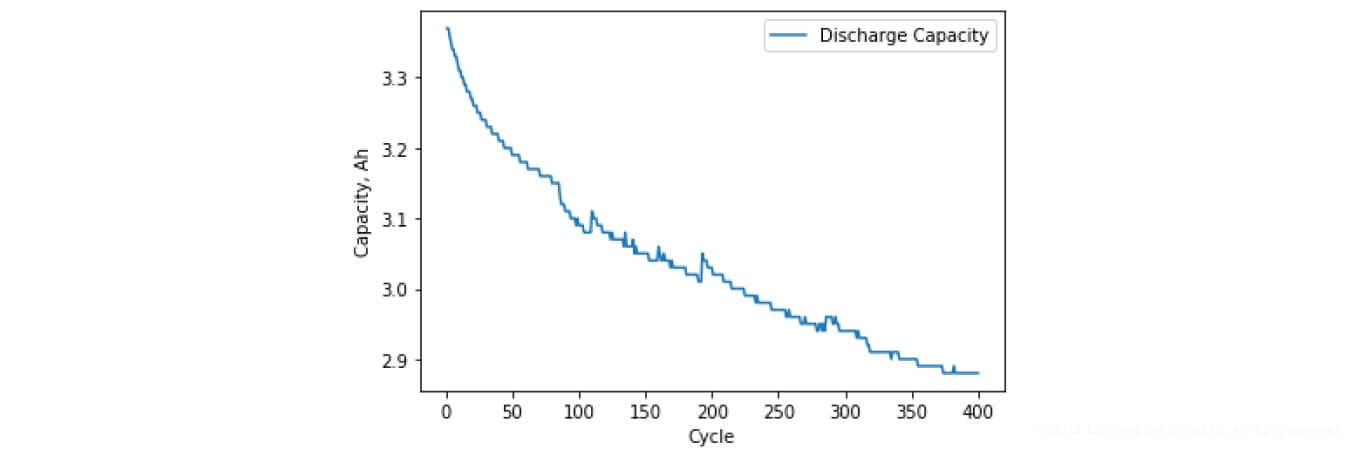
Figure 13. Capacity loss (based on discharge characteristics)
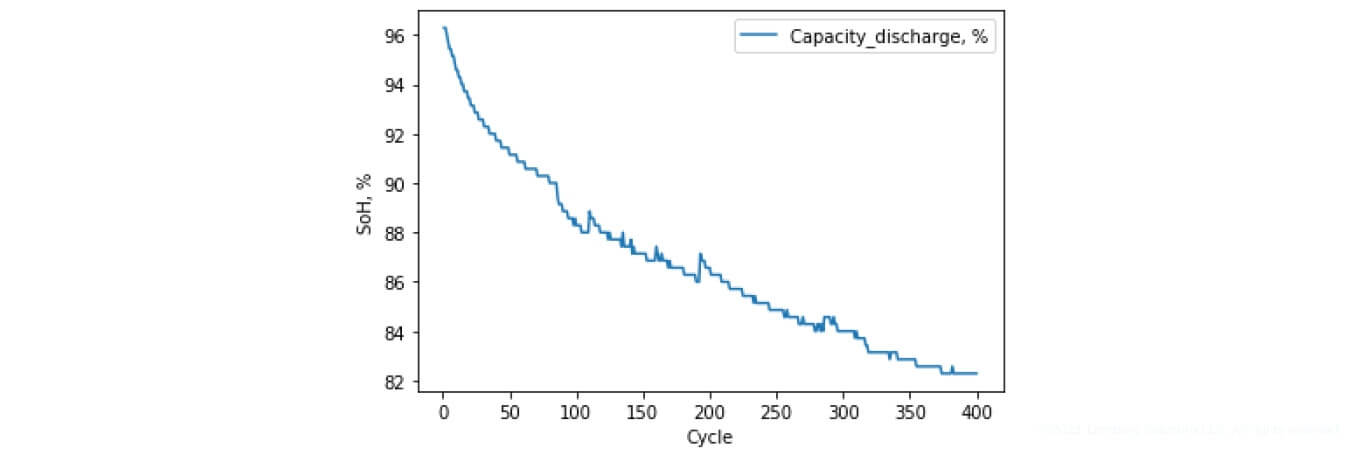
Figure 14. Representation of SoH according to charge and discharge cycles
These graphs depict the so-called battery recovery cycles (as presented in Figure 15). This is the expected battery behavior called capacitive regeneration, which directly affects the accuracy of the SoH determination.
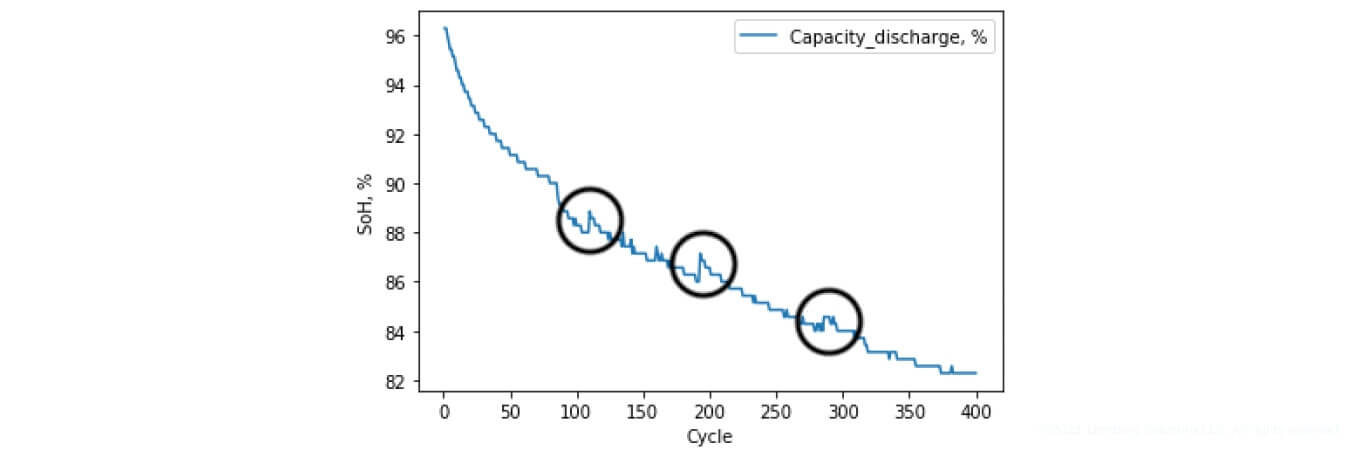
Figure 15. Capacitive battery regeneration
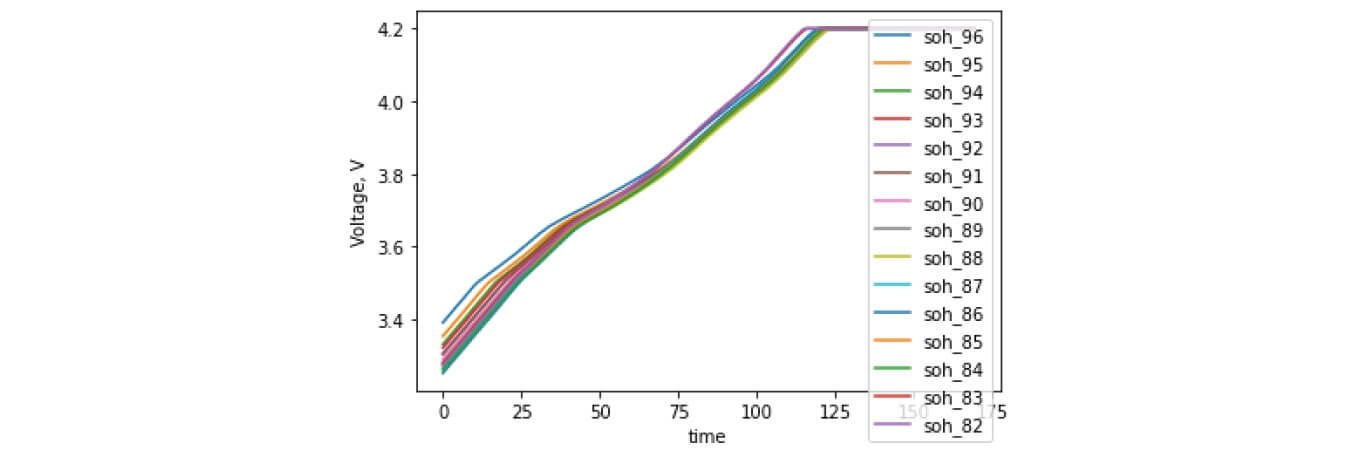
Figure 16. Reference charging characteristics for the SoH algorithm
As has already been mentioned, the presented dataset consists of 400 full charge and discharge cycles. The battery capacity loss range on this dataset makes 96% to 82%. Figure 16 demonstrates each charge curve for each SoH percentage within a given range. As you can see from the curve—the greater the loss of capacity, the further the curve shifts to the right (for this type of battery). This figure represents the 15 reference curves for the corresponding percentage of SoH.
 Our solution description
First of all, we initialize the parameters necessary for the operation of the algorithm—datasets responsible for the reference SoH values. Since the algorithm only works with the charge data, we have to wait for the start of charging. As soon as it occurs, we record the battery voltage and the time intervals of the collected data.
After the charging process is completed and the consumption current reaches a certain threshold level, in our case 100 mA, we calculate the statistical parameters necessary for determining the SoH value. In this case, these are MAPE (Mean Absolute Percentage Error) and Euclidean distance.
We determine the MAPE values and Euclidean distance between the rows to find the most appropriate ones in relation to SoH. This means, the smaller the MAPE and Euclidean distance values, the closer the recorded data series is to the corresponding reference value. If SoH is less than 80%, the battery (or its element) should be replaced.
The characteristics presented in Figure 17 are custom and are tailored to the specific battery type. It's crucial to pay attention to the charging and discharging peculiarities of batteries while implementing this algorithm. SoH curves may have a greater dependence on low or high voltages, which directly affect the accuracy of the algorithm. Additionally, if the BMS has a load–balancing function working via switching off the respective cells, this should also be taken into account during the implementation of such algorithms.
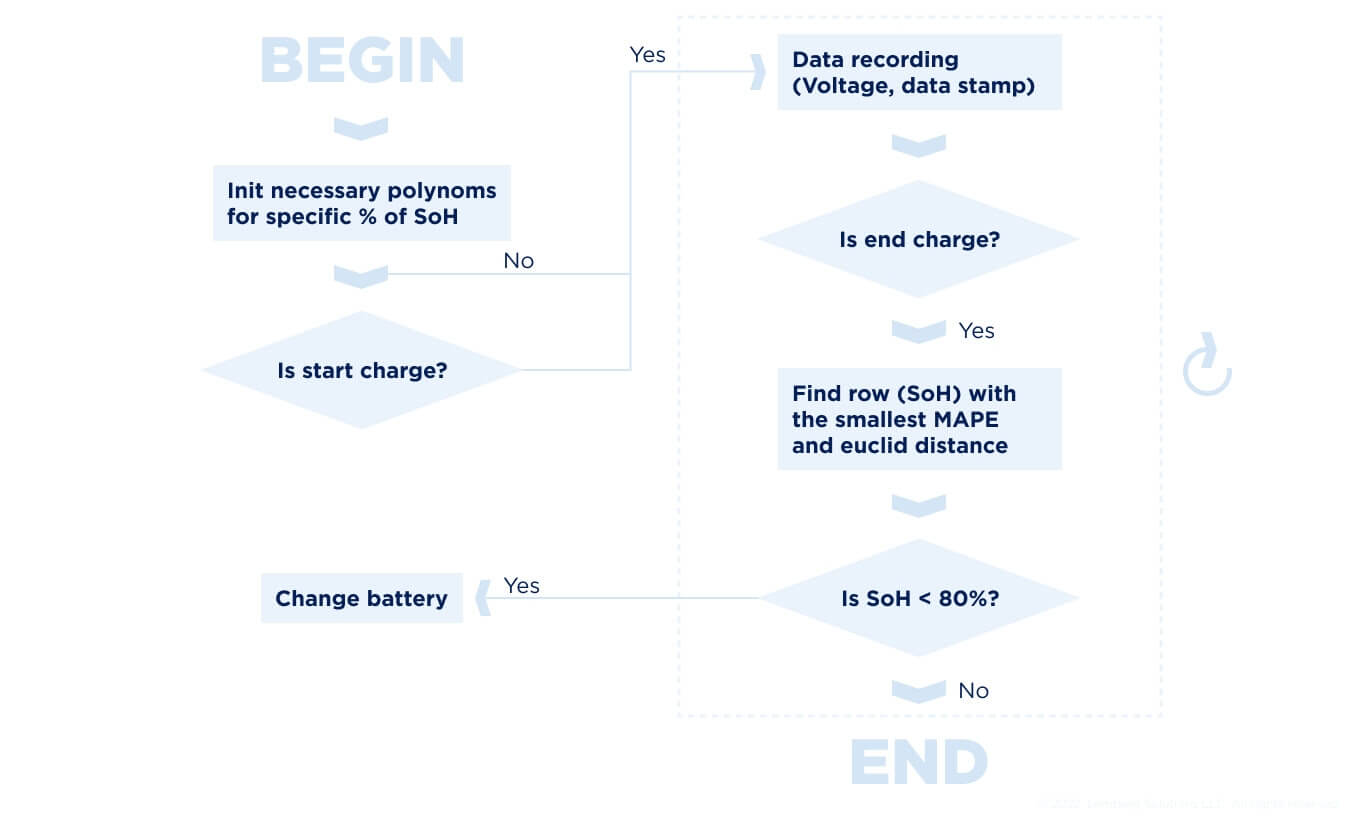
Figure 17. Block-diagram of the SoH determination algorithm
 Evaluating results of our solution
The presented algorithm for determining SoH was evaluated in terms of the accuracy of defining this parameter for two statistical indexes: MAPE and Euclidean distance.
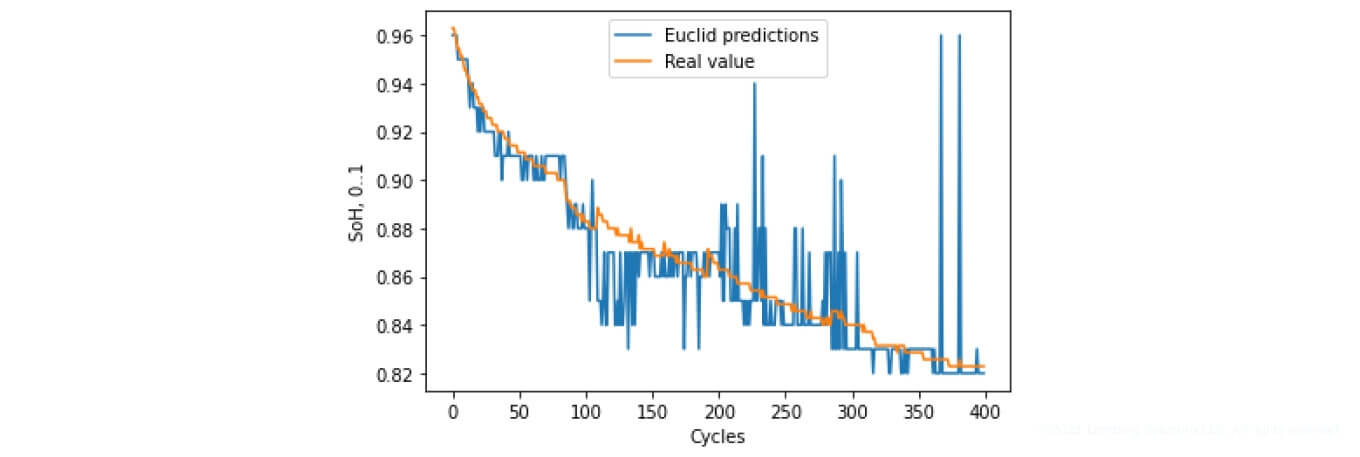
Figure 18. SoH forecasting based on Euclidean value
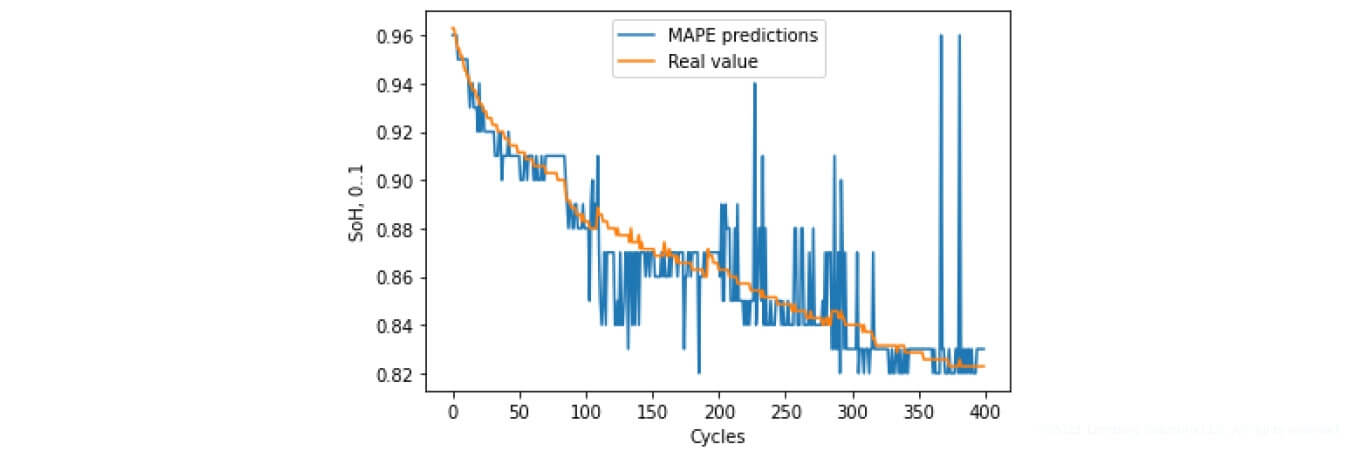
Figure 19. SoH forecasting based on MAPE
As you can see, the predicted SoH varies significantly for certain values. A large part of the changes is observed during the capacity regeneration process. The features of the reference datasets for the corresponding percentages also affect this tendency, as can be observed in Figure 17.
The average determination error for the two parameters is as follows:
MAPE: 1.0107%. (See Figure 21)
Euclidean distance: 0.9567 %. (See Figure 22)
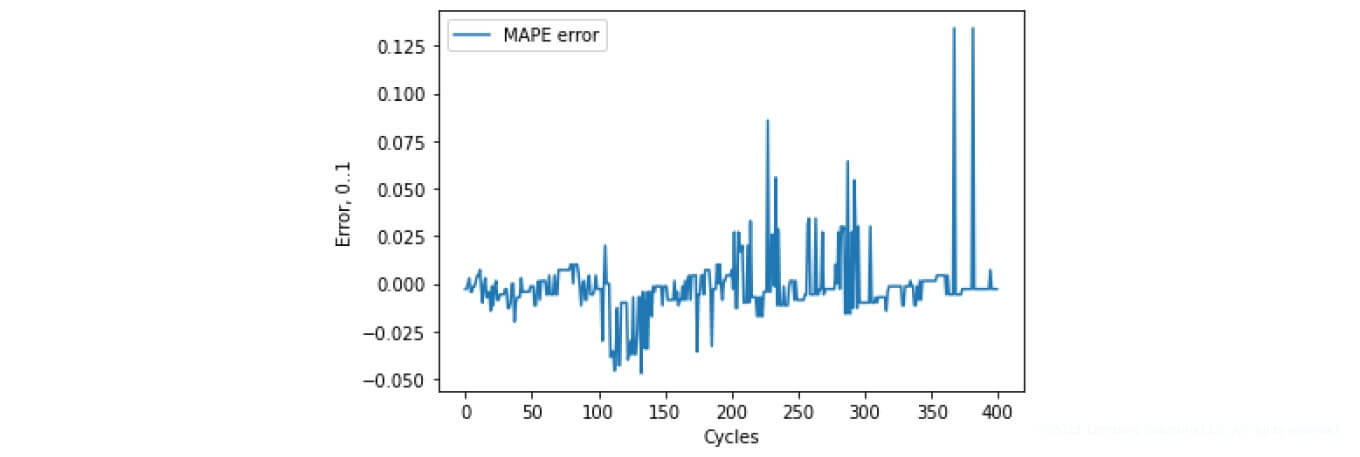
Figure 20. SoH determination error (MAPE)
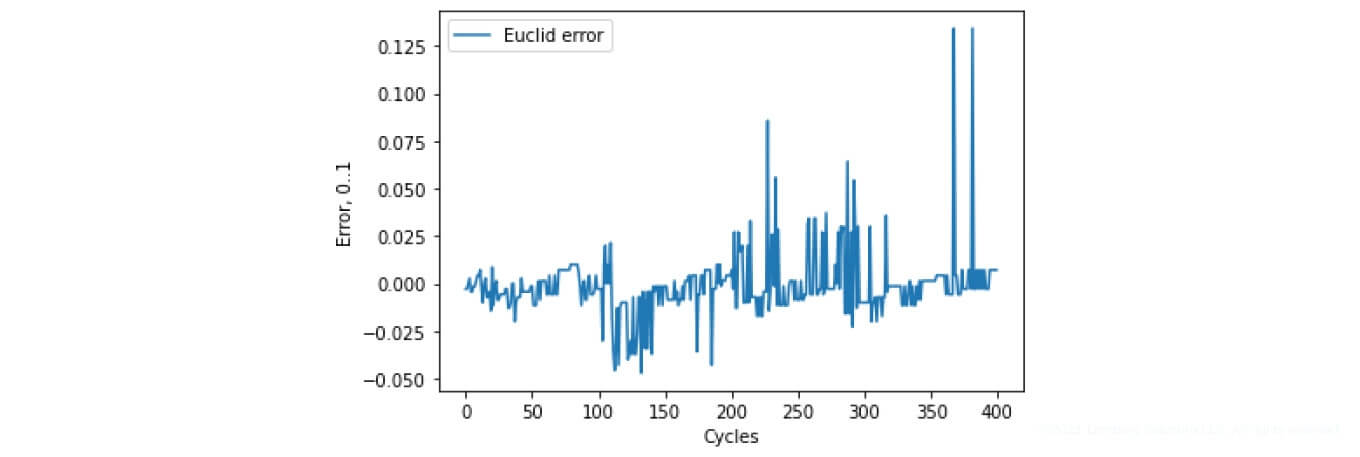
Figure 21. SoH determination error (Euclidean distance)
 Another dataset
We also used another dataset, based on 1841 charge and discharge cycles of the 18650 battery type. This research explores four batteries from different manufacturers:
1. Samsung ICR18650-30B (2950 mAh)
2. Joy NCR18650A300A(3000 mAh)
3. GP 03624RC 3.6 V(3000 mAh)
4. EVC 200L06C (2000 mAh).
Each of these batteries has its own capacity, type of positive electrode, and other individual characteristics. Using different batteries provides the opportunity to validate the approach presented in the previous subsection.
a)
b)
c)
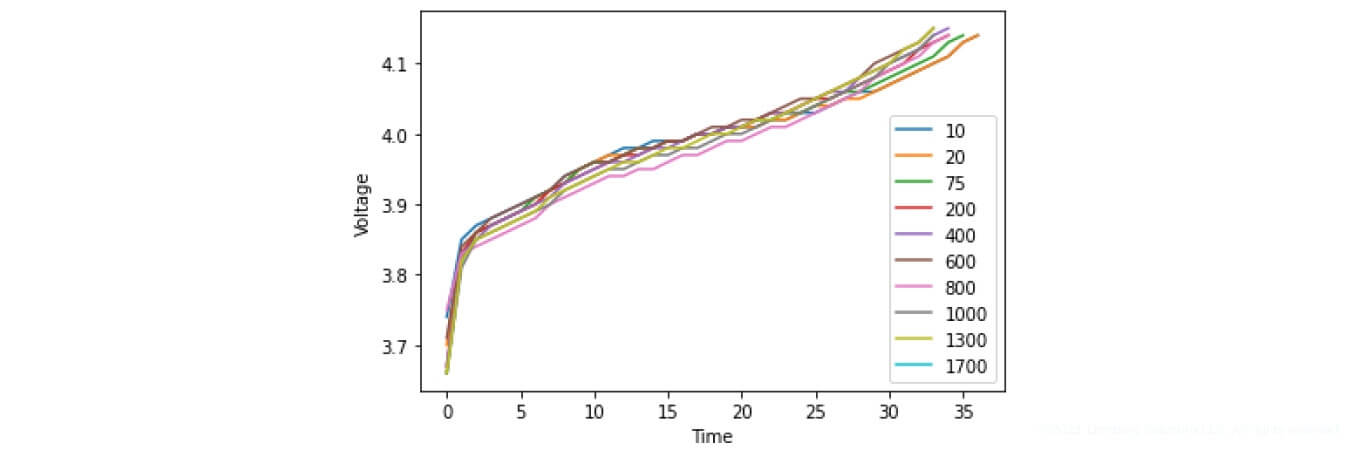
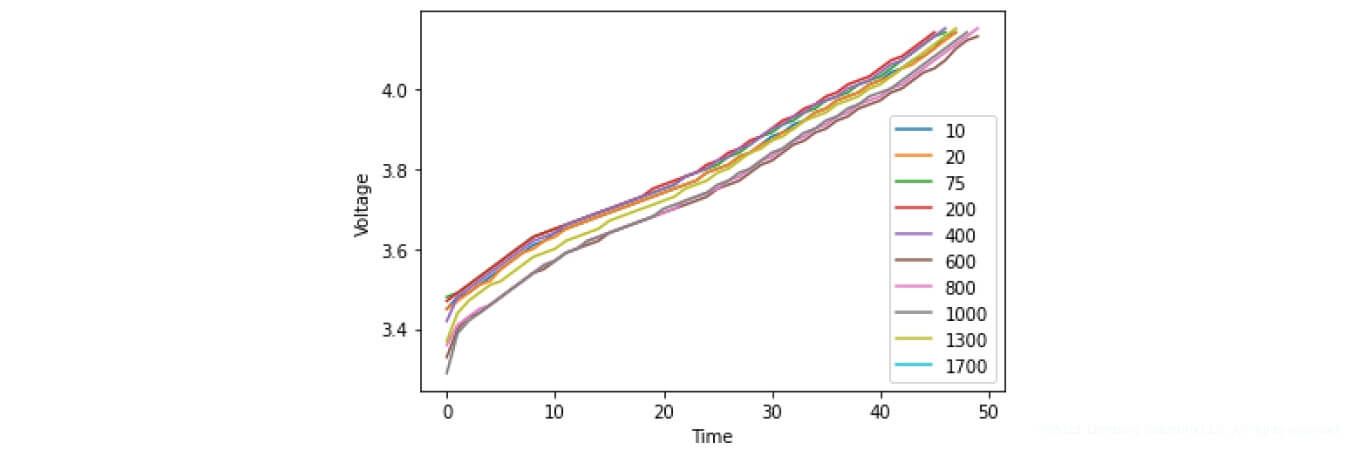
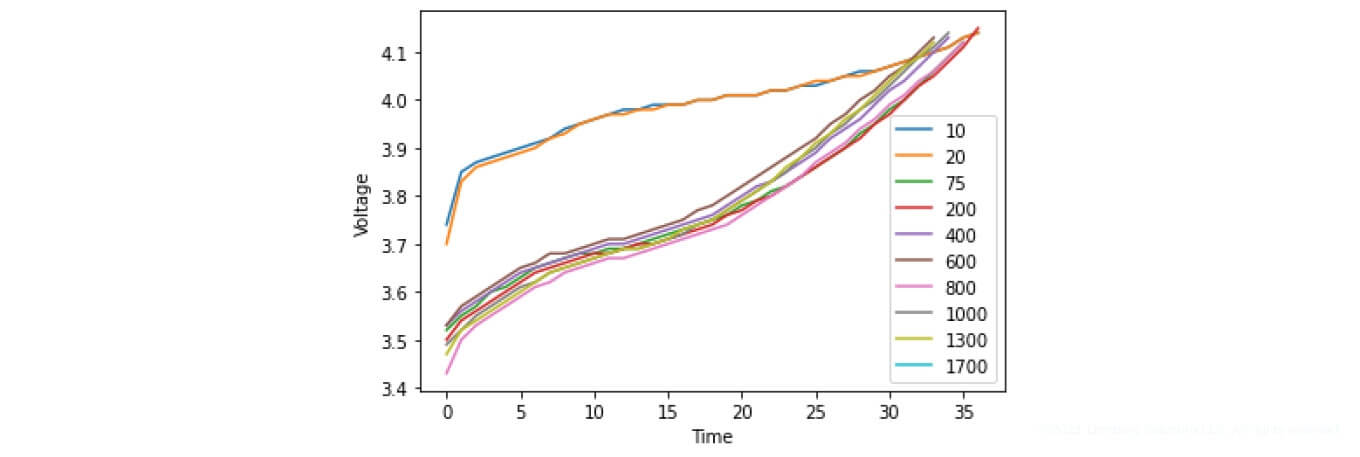
Figure 22. Battery charging characteristics a) Samsung ICR18650-30B (2950 mAh), b) Joy NCR18650A300A (3000 mAh), c) EVC 200L06C (2000 mAh)
Figure 22 demonstrates the charging cycles of the respective batteries. As you can see from the figures, the presented data has certain dependencies. For example, the battery lifespan decreases, depending on the charge and discharge cycle.
 Summing up
We presented our research on implementation of SoC and SoH algorithms using 18650 test batteries. In our study, we depicted the experimentally assembled OCV model, as well as the battery representation using the ECM in the algorithm for the EKF. Also, we outlined an approach that allows you to move from the OCV model representation to a method using a polynomial of the 9th degree. Additionally, we used statistical parameters, namely MAPE and Euclidean distance. You can get highly accurate results using this algorithm — the estimated error is around 1%.
Want to improve your product by utilizing cutting-edge solutions like the one described here? Lemberg Solutions has strong embedded engineering services expertise, as well as a proven track record of optimizing business processes with data science. Get in touch with our business development manager Olga Lysak on LinkedIn or simply drop us a line using our contact form. We'll get back to you shortly to discuss your tech requirements and business goals in order to plan our next steps together.


