A fleet intelligence dashboard for a Safety-aaS solution
Peregrine.ai is a German company that creates AI-powered software to improve safety on the road. Their dash cams for traffic video analytics allow fleet managers to examine the fleet's status in real time and conduct an accurate risk assessment to reduce the number of accidents in the future.
The challenge
Peregrine.ai needed to display their fleet statistics and event reports in a user-friendly way, so they looked for a tech vendor with a strong knowledge of Go that would undertake front- and back-end development and create an intuitive dashboard.
Delivered value
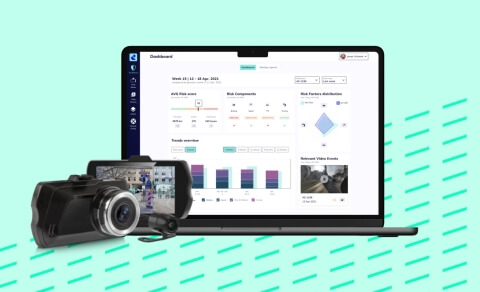
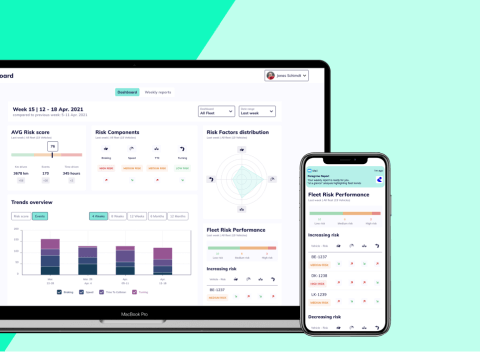
The LS team created a fleet statistics dashboard from scratch and optimized the graphics for risk events registered by intelligent dash cams. We developed a REST API for the dashboard, using the client's database and a GraphQL interface as backend for frontend. Also, our web developers implemented a feature for highlighting specific video events for Peregrine.ai admins.
The process
We met Peregrine.ai founders during the ITS Congress in Hamburg, which was dedicated to innovation in the mobility sphere. After the project estimation stage, we started our cooperation.
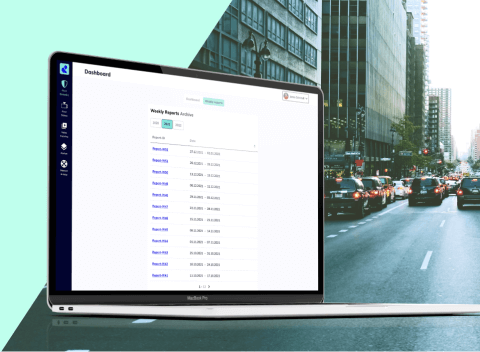
The main goal pursued by Peregrine.ai was a fleet intelligence dashboard, something which would be convenient for fleet managers. Our client already had a working platform with an extensive risk events archive and a page with detailed risk event reviews. Peregrine.ai also provided us with the designs for a future dashboard.
First, front- and back-end developers at Lemberg Solutions created a dynamic dashboard with a large number of graphics displaying vehicle statistics. The graphics included average risk score, risk components, risk factors distribution, trends overviews, as well as the top three vehicles involved in risk events and those that reduced such risks on the road. In addition, our team created filters for reviewing the statistics of a particular vehicle or a group of vehicles.
Second, our developers worked on a detailed page consisting of a chosen risk event video, a map showing the exact location of an event, and a graphic to which we added a runner that moved simultaneously with the vehicle on the video and showed detailed information about the event. On top of that, we added a feedback loop feature that allowed a driver to evaluate the level of hazard on a specific part of the road.
We also added specific functionalities to the product, such as video deletion and archiving features.
For front-end development, we applied React and GraphQL. The LS team created an in-between environment for transferring front-end requests to the back end. Our engineers used Golang to extract data from the client’s database as per request from the front end, and we also created a logic for the data extraction and transfer.
Since the product is multilingual (German and English), a number of titles on the graphics weren't displaying properly, and our team undertook fixing this issue.
The LS QA engineer tested the product during the whole development process to make sure all statistics and requests performed correctly.
How we work


Thanks to the contribution of Lemberg Solutions' front- and back-end developers, our clients enjoy an intuitive and easy-to-use dashboard that creates a more positive user experience with our video telematics solution. The team was always willing to go the extra mile, and the cooperation ran seamlessly.


